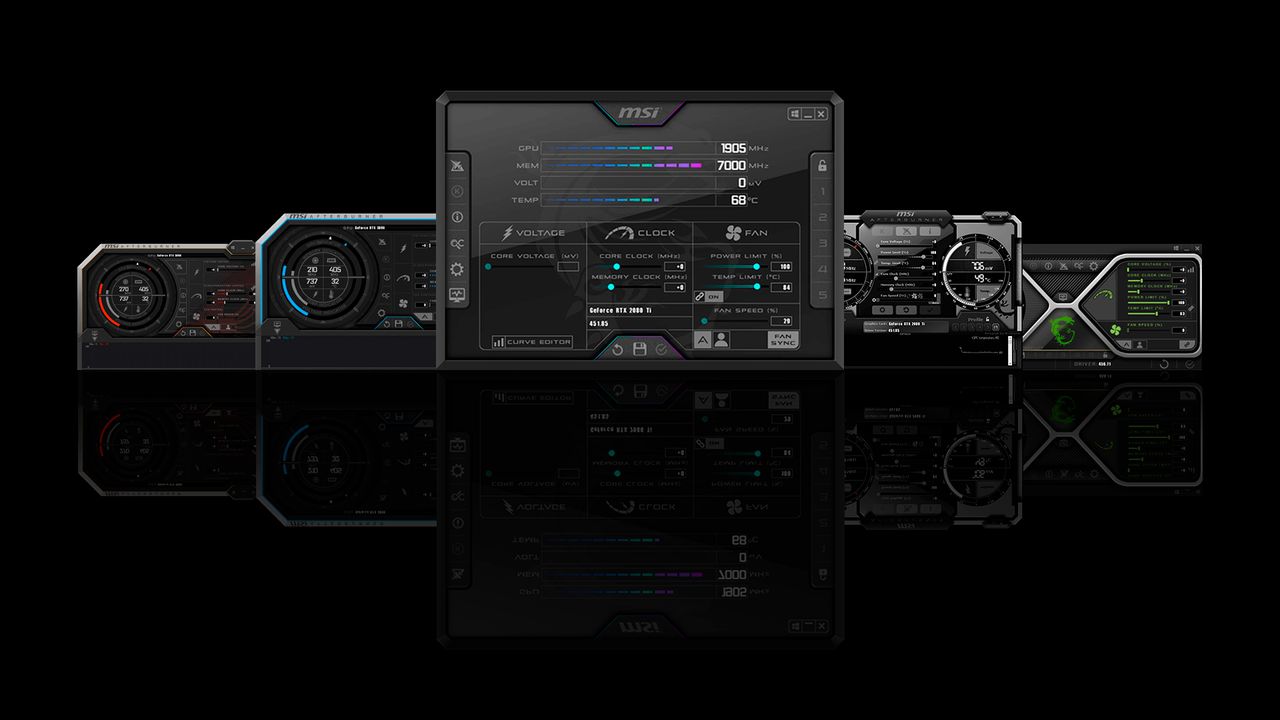
Overclocking looks like a gamer’s pursuit: push the graphics card a bit further to squeeze a few extra frames in a benchmark. But MSI’s latest move for Afterburner — a heatmap integrated into the voltage/frequency (V/F) curve editor — tells a story that is equally relevant for those managing on-premise inference workloads. Because the update, still undated, isn’t just an enthusiast’s whim: it makes transparent how the GPU boost behaves under prolonged loads, the kind typical of running Large Language Models locally, where peak instantaneous clock matters less than stability over minutes or hours.
The Afterburner V/F curve editor has been around for years, allowing to redefine the relationship between voltage and frequency at each operating point of the GPU. Until now, however, it remained a blank canvas: you could draw your curve, but you didn’t know exactly where the card spent its time. With the heatmap, every point on the curve will receive a visual density indicating for how long the graphics processor operated at that specific voltage-clock combination. It’s the equivalent of a distributed thermometer: you immediately see if the inference workload pins you in a zone where algorithmic boost — perhaps due to thermal or power limits — is sacrificing frequency intermittently.
For anyone evaluating on-premise deployment, especially on consumer or workstation GPUs, this detail is far from marginal. Many LLM models, when served via Ollama or llama.cpp, occupy the VRAM continuously: token after token, the card runs at a high duty cycle, and the boost behavior becomes predictable only if you know the power and temperature constraints governing it. The heatmap turns Afterburner into a diagnostic tool almost at lab level: instead of settling for a “safe” undervolt suggested by forums, you can verify whether the real workload pushes the GPU outside its efficiency window, causing a hidden reduction in memory bandwidth or increased latency.
There is a second, more structural effect. The community that optimizes hardware for AI workloads has always drawn from overclocking techniques, but the exchange has been anecdotal so far: someone posts a curve on Reddit, someone else tests it on a different model, all without a common language. A heatmap integrated into the most widespread tuning tool for NVIDIA and AMD cards creates a shared ground to compare load profiles. It is not unlikely that “LLM-optimized” presets will soon circulate, developed precisely with this feature: curves that favor VRAM clock over the core, or that lock voltage below thresholds where the fan ceases to be an office disturbance.
Of course, any intervention on V/F curves carries risks of instability or hardware damage if pushed to extremes, and this holds especially true for workstations that must guarantee uptime for enterprise inference. But the point isn’t to encourage extreme overclock: it’s to provide granular visibility into what actually happens inside the chip, visibility that previously required external sensors or less immediate monitoring software. For organizations with small clusters of consumer GPUs serving internal models, understanding where thermal bottlenecks accumulate means being able to size the system in a less empirical way, reducing TCO over the medium term.
The fact that Afterburner, a software born for competitive gaming, is evolving toward features that speak directly to the local inference world signals something: the boundary between consumer and professional is no longer traced by hardware but by the tools used to interrogate it. Data sovereignty often passes through a rack of cards mounted in a tower case, and the difference between a silent deployment and a troubled one lies in small tuning details that, today, have just gained a new level of transparency.




💬 Comments (0)
🔒 Log in or register to comment on articles.
No comments yet. Be the first to comment!